Create a Backend Application with a Sidecar and OAuth2 Authentication
Advanced Usecase
This example demonstrates how to develop a Kubernetes sidecar pattern for an OAuth2 (OpenID Connect) authorized backend service using Gefyra.
This is more of an advanced use-case, if you just want an easy example of how Gefyra works, check out the getting started guide.
What you will learn
- Create a (Python-based) backend application that reads a JWT (JSON web token)
- Get a local identity provider with Keycloak
- Apply the Kubernetes sidecar pattern with OAuth2-Proxy and connect the app to Keycloak
- Find and fix a bug
- Start coding locally within the Kubernetes cluster having the sidecar active
What you will need
- Gefyra
- Getdeck for setting up the development infrastructure (runs on
k3d) - kubectl
- A copy of https://github.com/gefyrahq/gefyra-demos
- Optionally: k3d or any other preferred Kubernetes cluster
- Optionally: VSCode with Python debugger installed (or any other preferred IDE)
That's about it. Let's get started.
Creating the Development Infrastructure
First, we need a Kubernetes-based development infrastructure which contains all required components. Luckily this can
be achieved quite easily with the Deck CLI from here.
Just run:
deck get --name oauth2-demo https://github.com/gefyrahq/gefyra-demos.git
and you will get a fresh k3d cluster running locally with all required components installed.
Important: These workloads are intended for demonstration purposes and are not safe for production deployments.
Optional: If you don't want to create the development infrastructure using Getdeck you can also provide it
yourself. You need:
- a Kubernetes cluster
- an identity provider (preferably Keycloak)
- a custom realm with an oauth2 client for the backend service
- a test user with required privileges
- ingress config that supports a full-fledged oauth2 login flow
- the workload manifests for the backend application with the OAuth2-Proxy sidecar
Getting the App Running
Optional: In order to observe the workload booting up, check out
the Kubernetes dashboard coming with this deck.
A healthy cluster looks like this:
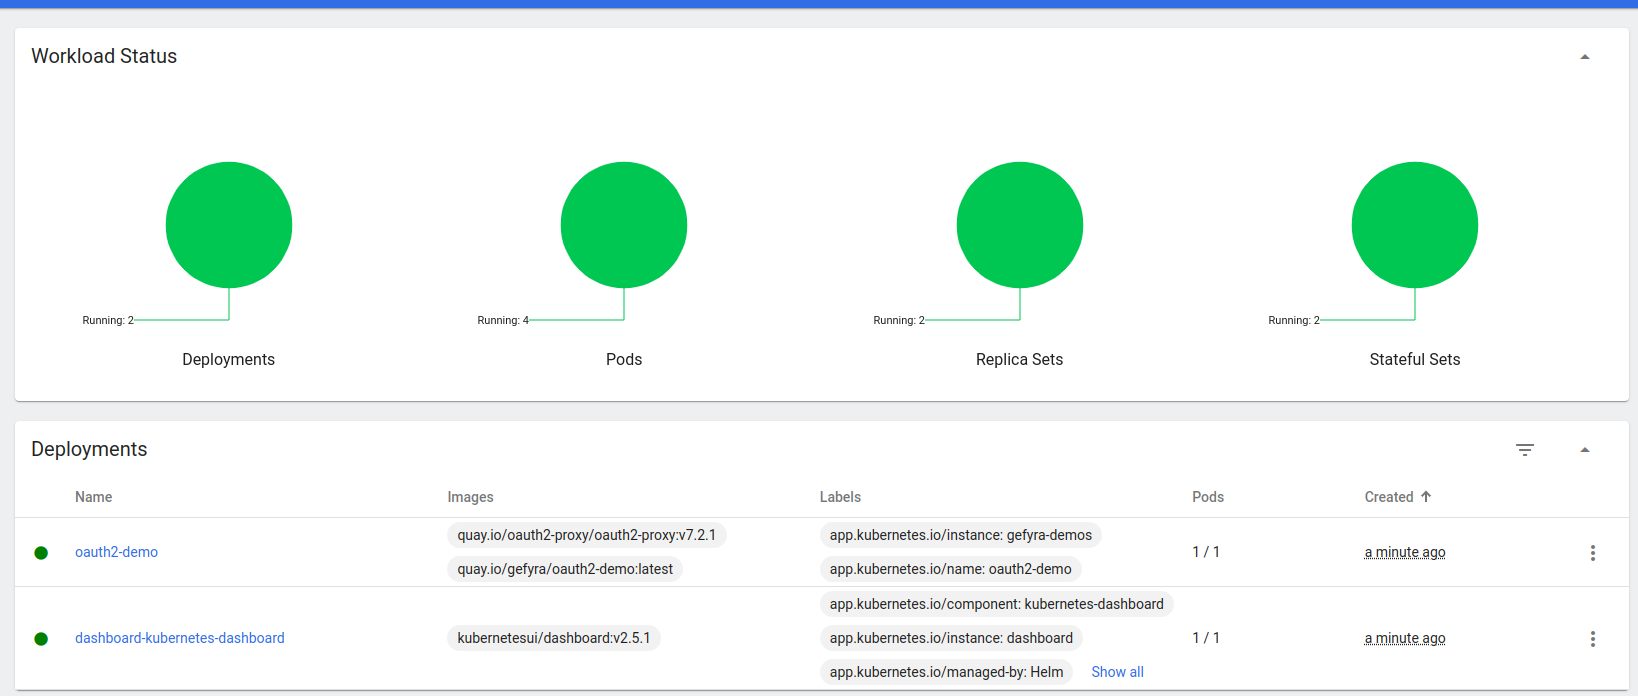
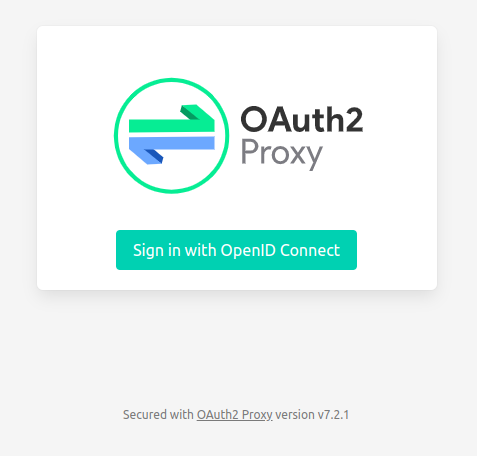
Once you have the workload running in Kubernetes, head over to http://oauth2-demo.127.0.0.1.nip.io:8080/.
The following page should come up asking you to sign in with OpenID Connect:
Once you click the button you will be redirected to the central login of Keycloak, which looks like this:
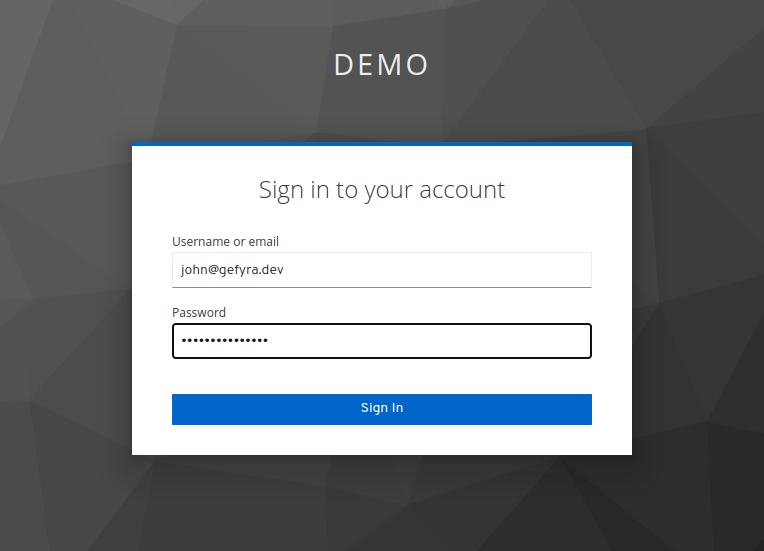
Please notice how you got redirected to the local domain of Keycloak (http://keycloak.127.0.0.1.nip.io:8080/...).
The demo workload contains a prepared user in Keycloak's database. You can use it to perform a login. The credentials are as follows:
Username: john@gefyra.dev
Password: john@gefyra.dev
Once you hit the Sign In button you will be redirected back to the beginning, but this time you will see the json output of the backend service:
{"Hello":"World"}
Voilà, we have a full-fledged OpenID Connect login flow running in a Kubernetes cluster.
So are we done yet? Not quite. Let's move on to the internals.
The Scheme of the Infrastructure
Kubernetes Overview
The Kubernetes cluster is running three important components for this use case:
- Keycloak: the identity provider compatible with OpenID Connect (OIDC)
- OAuth2-Proxy: a reverse proxy compatible with OpenID Connect
- Backend Application: a FastAPI application
The OAuth2-Proxy is implemented as a sidecar and runs side-by-side in each Pod with the backend application. If you are not yet familiar with the sidecar pattern please check out this resource. Keycloak runs in a StatefulSet and is connected to a PostgreSQL database.
The Kubernetes objects of the workload are as follows:
In this picture you can find two Ingresses definitions: one is serving the application Deployment oauth2-demo which schedules one Pod under oauth2-demo.127.0.0.1.nip.io:8080, the other is serving Keycloak under keycloak.127.0.0.1.nip.io:8080.
Important: Please mind that port 8080 is a port mapping. From within the cluster you will see it running on port 80.
You can introspect the Ingress also with kubectl:
$> kubectl --namespace oauth2-demo get ingress
NAME                             CLASS    HOSTS                          ADDRESS      PORTS     AGE
keycloak                         <none>   keycloak.127.0.0.1.nip.io      172.23.0.2   80, 443   56m
keycloak-console                 <none>   keycloak.127.0.0.1.nip.io      172.23.0.2   80, 443   56m
oauth2-demo                      <none>   oauth2-demo.127.0.0.1.nip.io   172.23.0.2   80        56m
dashboard-kubernetes-dashboard   <none>   dashboard.127.0.0.1.nip.io     172.23.0.2   80        56m
The next layer adds the Kubernetes Service objects which are required to access a Pod.
You can introspect the Services also with kubectl:
$> kubectl --namespace oauth2-demo get service
NAME                             TYPE        CLUSTER-IP      EXTERNAL-IP   PORT(S)                    AGE
keycloak-http                    ClusterIP   10.43.40.200    <none>        80/TCP,8443/TCP,9990/TCP   62m
keycloak-headless                ClusterIP   None            <none>        80/TCP                     62m
keycloak-postgresql              ClusterIP   10.43.231.210   <none>        5432/TCP                   62m
keycloak-postgresql-headless     ClusterIP   None            <none>        5432/TCP                   62m
oauth2-demo                      ClusterIP   10.43.160.68    <none>        8080/TCP                   62m
dashboard-kubernetes-dashboard   ClusterIP   10.43.159.219   <none>        61348/TCP                  62m
Please ignore the other services as they are not important for this example.
Finally, please also check out the Pods in the cluster's namespace with kubectl. It should be similar to:
$> kubectl --namespace oauth2-demo get pod
NAME                                              READY   STATUS    RESTARTS   AGE
oauth2-demo-675f5c55b5-xxj57                      2/2     Running   0          63m
dashboard-kubernetes-dashboard-65dbdd8978-gd9jt   1/1     Running   0          63m
keycloak-postgresql-0                             1/1     Running   0          63m
keycloak-0                                        1/1     Running   0          63m
The OAuth2-Demo Sidecar Workload
If you want to know more about the implementation of the sidecar pattern in this example please head over to the workload manifest. The important part is that the Pod template specifies two containers. The first is name: oauth2-proxy and the second is name: oauth2-demo-app:
[...]
containers:
- name: oauth2-proxy
  image: quay.io/oauth2-proxy/oauth2-proxy:v7.2.1
  imagePullPolicy: IfNotPresent
  [...]
  ports:
    - containerPort: 8809
      protocol: TCP
      name: http
  envFrom:
    - configMapRef:
        name: oauth2-oauth2proxy
- name: oauth2-demo-app
  [...]
  image: "quay.io/gefyra/oauth2-demo:latest"
  imagePullPolicy: Always
  ports:
    - name: http-intern
      containerPort: 8155
      protocol: TCP
[...]
Please have a closer look at the port configuration. The oauth2-proxy runs on port 8809 (with name http) and oauth2-demo-app
runs on port 8155. You can describe the associated service with kubectl to see which of both ports the traffic is pointed to:
$> kubectl -n oauth2-demo describe service oauth2-demo
Name:              oauth2-demo
Namespace:         oauth2-demo
Labels:            app.kubernetes.io/instance=gefyra-demos
                   app.kubernetes.io/name=oauth2-demo
Annotations:       <none>
Selector:          app.kubernetes.io/instance=gefyra-demos,app.kubernetes.io/name=oauth2-demo
Type:              ClusterIP
IP Families:       <none>
IP:                10.43.160.68
IPs:               10.43.160.68
Port:              http  8080/TCP
TargetPort:        http/TCP
Endpoints:         10.42.1.4:8809
Session Affinity:  None
Events:            <none>
For the sidecar pattern to function, the service speaks to the target Pod on port 8809 which is served by the oauth2-proxy. A closer review of oauth2-proxy's configuration reveals to which address the proxy upstreams all requests:
[...]
OAUTH2_PROXY_UPSTREAMS: "http://127.0.0.1:8155"
[...]
This is precisely the connection to the backend application in each Pod.
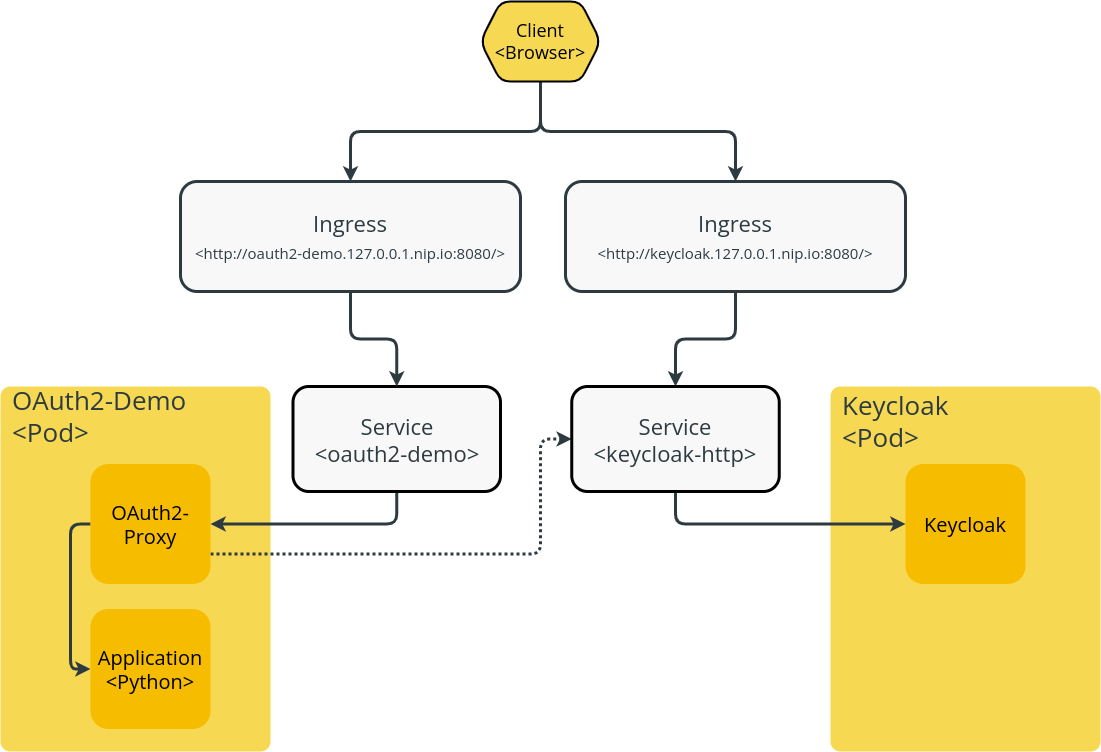
The OpenID Connect Flow in Brief
The following image depicts the OpenID Connect flow in brief how it is working in this example:
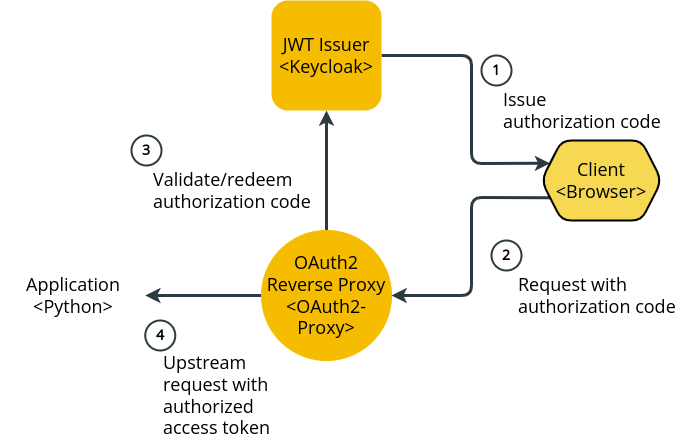
As you can see, the OAuth2-Proxy only passes authenticated traffic to the backend application. That breaks the application free from (potentially unsafe) custom OIDC code and authorization handling. This is standard procedure and should not be part of your code. Make use of this pattern when having this requirement.
Ok! Enough for the workload internals. Let's check out how Gefyra helps out with fixing nasty bugs.
The Example Bug
If you hit the troublesome route http://oauth2-demo.127.0.0.1.nip.io:8080/items/123
(with 123 as an example for any int value) you will face the Internal Server Error message. That is a HTTP 500 status.
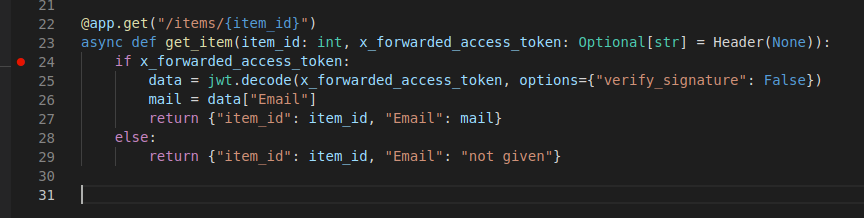
The code being executed can be found
here: https://github.com/gefyrahq/gefyra-demos/blob/main/oauth2-demo/app/main.py#L23
@app.get("/items/{item_id}")
async def get_item(item_id: int, x_forwarded_access_token: Optional[str] = Header(None)):
    if x_forwarded_access_token:
        data = jwt.decode(x_forwarded_access_token, options={"verify_signature": False})
        mail = data["Email"]
        return {"item_id": item_id, "Email": mail}
    else:
        return {"item_id": item_id, "Email": "not given"}
Of course, you are a very attentive reader and found the mistake immediately, but let's move on for the sake of this example.
Gefyra to the Rescue
As always, the first would be to spin up Gefyra with
gefyra up. Please be sure to still have the development cluster active in your current kubectl context.
Running a Development Instance of the Container
In order to inspect the application and pinpoint the bug, it requires a local instance of the container. Ideally with a
debug server running. Since you need the sidecar in place (for the OIDC logic), the development instance must be placed
in a Pod with the sidecar pattern. Gefyra offers you a unique mechanism to achieve exactly that.
Start the development instance like so (set LOCAL_DIR to the directory where you've copied/cloned gefyra-demos to):
$> export LOCAL_DIR=/home/<...>/gefyra-demos/oauth2-demo/app
$> gefyra run -i quay.io/gefyra/oauth2-demo -N myfastapi-demo \
    -n oauth2-demo -v $LOCAL_DIR:/app \
    -c "bash -c 'python -m debugpy --wait-for-client --listen 0.0.0.0:5678 -m uvicorn main:app --host 0.0.0.0 --port 8155 --reload'"
No worries, the following explains the parameter list:
- -i quay.io/gefyra/oauth2-demo: run the Docker image which is also running in the cluster
- -N myfastapi-demo: name this local Docker instance myfastapi-demo for further reference
- -n oauth2-demo: place this Docker instance in the Kubernetes namespace oauth2-demo (where this example plays)
- -v /home/<...>/gefyra-demos/oauth2-demo/app:/app: mount the source code on your disk to this Docker instance at /app
- -c "CMD": start this Docker instance with debugpy, the rest is like from the Kubernetes workload manifest of the application
debugpy is an implementation of the Debug Adapter Protocol for Python. This protocol is also available for a countless number of programming languages. It basically spins up a server, in this case waiting for a debugger client to connect, and runs the application wrapped in with debugging capabilities.
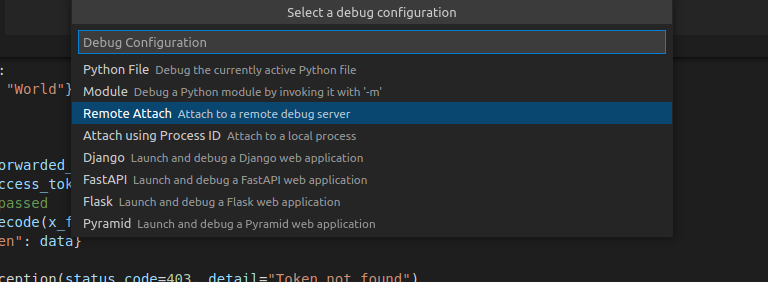
Attaching a Debugger to the Development Instance
Now that you are running a development instance with this Docker image locally, you need to connect the debugger client.
This example is prepared with VSCode and the Python extension installed.
In order to do that, you need to find out the local IP address Gefyra assigned to your container with:
{% raw %}
$> docker inspect -f '{{range.NetworkSettings.Networks}}{{.IPAddress}}{{end}}' myfastapi-demo
{% endraw %} This will be part of the CLI soon (or maybe it already is). The command shown tells the IP of the container which is needed for VSCode.
Please get the code for the backend application from the repository and open up VSCode.
Select the Remote Attach option to connect to the running debugpy instance at the given IP. The port is 5678 (please review the command above).
In the DEBUG CONSOLE it will display the following output:
INFO:     Will watch for changes in these directories: ['/app']
INFO:     Uvicorn running on http://0.0.0.0:8155 (Press CTRL+C to quit)
INFO:     Started reloader process [438166] using watchgod
Awesome. You have a debugger connected to the development instance. Now it's time to receive a request from the oauth2-proxy container.
Bridging the Development Instance in the Cluster
In order to receive requests (i.e. traffic) from within the cluster, basically when you hit the route http://oauth2-demo.127.0.0.1.nip.io:8080/items/123
in your browser, a gefyra bridge ... is needed.
Just create a bridge with:
$> gefyra bridge -N myfastapi-demo -n oauth2-demo \
      --target deploy/oauth2-demo/oauth2-demo-app \
      --port 8155:8155
[INFO] Creating bridge for Pod oauth2-demo-675f5c55b5-xxj57
[INFO] Waiting for the bridge(s) to become active
[INFO] Bridge myfastapi established
The parameter list specifies the following:
- -N myfastapi-demo: the bridge targets (on one end) the local Docker instance with the name myfastapi-demo
- -n oauth2-demo: the target workload (the other end of the bridge) is in the Kubernetes namespace oauth2-demo
- --deployment oauth2-demo: Gefyra intercepts all Pods of the Deployment oauth2-demo (don't confuse it with the name of the namespace)
- --port 8155:8155: the bridge to map port 8155 of the container in the cluster to 8155 on the local instance
- --container-name oauth2-demo-app: since this Pod contains multiple containers (see the sidecar pattern above), Gefyra is asked to intercept the application container oauth2-demo-app
Debugging the Application
Now you are ready to stop the execution of the code in your VSCode debugger. Place the breakpoint anywhere near the position you would expect the error to happen:
Point your browser to http://oauth2-demo.127.0.0.1.nip.io:8080/items/123 again.
Once you hit the breakpoint, you can easily look around and introspect the JWT (json web token) issued from Keycloak and verified with OAuth2-Proxy.
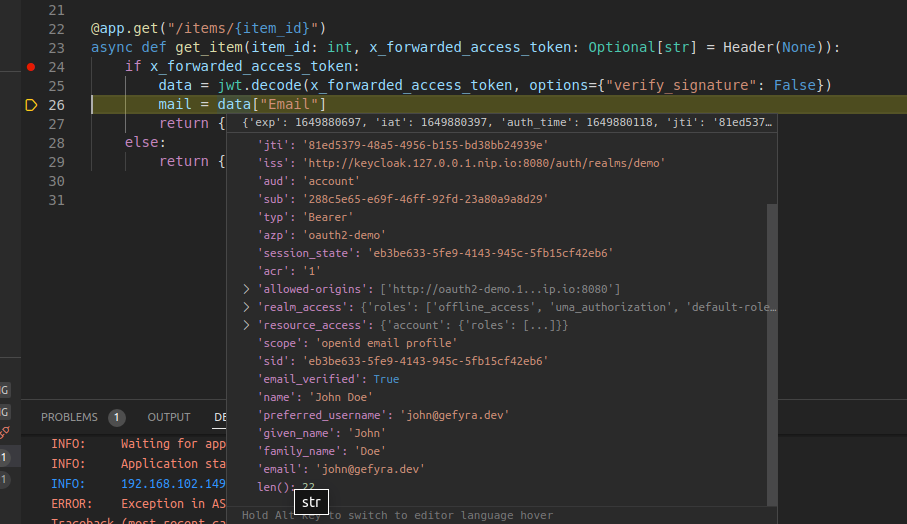
As you may see, the key in the token is written in a lowercase "email". This is causing the KeyError: 'Email' resulting in a 500 error.
Remark: Of course you could have found this out reading the logs, but where is the fun? Anyway, debugging software is a tool for hunting down causes of way more complex misbehaving then in this example.
Fixing the Bug
Since the development instance is started with your local source code mounted into the container and the --reload flag turned on, please move on and fix this bug. The fix looks like this:
[...]
        data = jwt.decode(x_forwarded_access_token, options={"verify_signature": False})
        mail = data["email"]  # the key is with a lowercase 'email'
        return {"item_id": item_id, "Email": mail}
[...]
Once you have saved the changes, the application is immediately restarted with the fixed code.
The output of the route http://oauth2-demo.127.0.0.1.nip.io:8080/items/123 is
now in the browser:
{"item_id":123,"Email":"john@gefyra.dev"}
Awesome! Commit and push.
This way you can be quite sure that this will work in all Kubernetes environments provisioned with these workloads.
Remark: Gefyra is able to run and bridge as many applications as you need. This is useful in complex request/response scenarios with multiple involved services - and potentially all with a debugger attached. Isn't that neat?
Shutting Down Gefyra
In order to clean everything up, you can run gefyra down. This will remove the running bridges and shut down the development
container instances. You will now find the cluster reset to the state with the original bug around. For the fix to become persistent
you will need to roll out a new version of the container image specified in the Kubernetes workload manifest.
Remove the Development Infrastructure
If you have initially created the development infrastructure using Getdeck you can now run:
$> deck remove --cluster https://github.com/gefyrahq/gefyra-demos.git
[INFO] Deleting the k3d cluster with name gefyra-demos
If you created the infrastructure yourself, you probably already know how to get rid of everything yourself ;-)
Additional Notes
If you want maximum convenience for your developers and a supported team oriented workflow, we recommend you check out Unikube. Gefyra is part of Unikube's development workflow.
If you are developing django applications, be sure to check out Django-Hurricane, a Kubernetes-native stack specifically created for django and Pycloak, a package that's makes it super easy to integrate OpenID Connect/OAuth2 workflows in django.